Plot Single-Scattering Properties
Go back to the list of notebooks if this is not what you are looking for
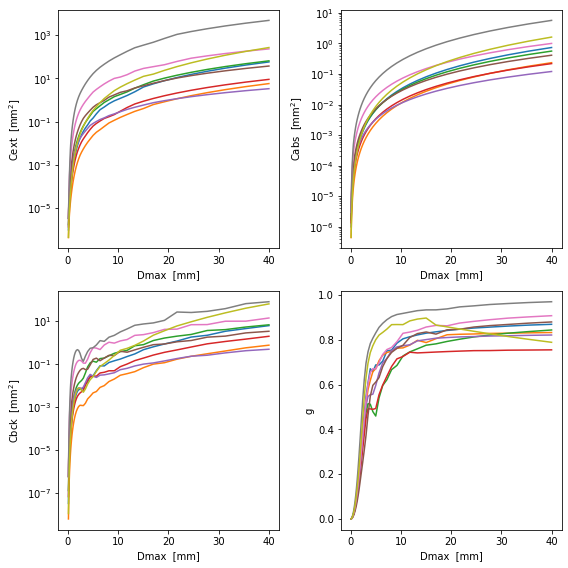
This notebook show how to use snowScatt to compute the single scattering properties of some particle properties
[1]:
import numpy as np
import pandas as pd
import matplotlib.pyplot as plt
import datetime
begin = datetime.datetime.now()

import snowScatt

particle_types = ["vonTerzi_plate",
                  "vonTerzi_dendrite",
                  "vonTerzi_column",
                  "vonTerzi_needle",
                  "vonTerzi_mixcoldend",
                  "Leinonen15tabB02",
                  "Leinonen15tabB05",
                  "Leinonen15tabB20",
                  "Ori_collColumns"]
particle_labels = ["CaE plate",
                   "CaE dendrite",
                   "CaE column",
                   "CaE needle",
                   "CaE mix",
                   "LS15 B02",
                   "LS15 B05",
                   "LS15 B20",
                   "Ori14 column"]

diameters   = np.logspace(-4,np.log10(4e-2))

fig, axes = plt.subplots(2, 2, figsize=(8, 8))

for i, particle in enumerate(particle_types):
    results = snowScatt.calcProperties(diameters=diameters,
                                       wavelength=3.19e-3, # W-band radar 94 GHz
                                       properties=particle,
                                       temperature=270, # compute refractive index internally from Iwabuchi 2010
                                      )
    Cext, Cabs, Csca, Cbck, asym, phase, mass_prop, vel, area = results
    axes[0, 0].plot(diameters*1.0e3, Cext*1.0e6, label=particle_labels[i])
    axes[0, 1].plot(diameters*1.0e3, Cabs*1.0e6, label=particle_labels[i])
    axes[1, 0].plot(diameters*1.0e3, Cbck*1.0e6, label=particle_labels[i])
    axes[1, 1].plot(diameters*1.0e3, asym, label=particle_labels[i])

axes[0, 0].set_yscale('log')
axes[0, 1].set_yscale('log')
axes[1, 0].set_yscale('log')

axes[0, 0].set_xlabel('Dmax  [mm]')
axes[0, 1].set_xlabel('Dmax  [mm]')
axes[1, 0].set_xlabel('Dmax  [mm]')
axes[1, 1].set_xlabel('Dmax  [mm]')

axes[0, 0].set_ylabel('Cext  [mm$^2$]')
axes[0, 1].set_ylabel('Cabs  [mm$^2$]')
axes[1, 0].set_ylabel('Cbck  [mm$^2$]')
axes[1, 1].set_ylabel('g')
fig.tight_layout()
Go back to the list of notebooks for some more snow studies